
-b_Big.jpg "Half-Year Trade Review: India’s Chemical Exports to the US (2025)")
AlchemPro presents a detailed analysis on chapter-wise chemical exports from India to the United States for the period January to June 2025. As one of India’s largest trading partners, the United States continues to play a pivotal role in shaping India's external trade dynamics. Understanding the composition, trends, and performance of export sectors during this period provides valuable insights into the evolving trade relationship, sectoral competitiveness, and emerging market opportunities.
Understanding Sectoral Performance in India–US Chemical Trade
The analysis is structured according to the Harmonized System (HS) chapters, enabling a granular view of export performance across key product categories —Organic chemicals, Inorganic chemicals and Miscellaneous chemicals. Each chapter offers an overview, comparative growth patterns, and notable shifts in export volumes and values, alongside potential drivers and external factors influencing trade.
|
Chapter |
Key Products |
Trend Overview |
Demand & Supply Concerns |
Upward Phase |
Downward Phase |
Tariff / Trade Note |
|
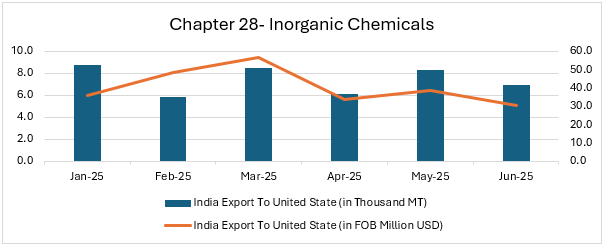
Chapter 28 – Inorganic Chemicals |
Iron Oxide, Aluminium Oxide, Magnesium Sulphate Heptahydrate, Copper Chloride, Carbon Black, Calcium Chloride, Tri Sodium Phosphate, Sodium Permanganate, Zinc Oxide, Sodium Nitrite, Insoluble Sulphur and many more. |
Exports to the USA fluctuated in volume (5.8–8.8 thousand MT) and value (30.4–56.5 million USD) during Jan–Jun 2025. Value trends diverged from volumes, showing strong price-led movement in Feb–Mar (high value despite moderate tonnage), while Apr–Jun saw price corrections and lower realizations. End-use industries include construction, agriculture, automotive & tire, water treatment, and electronics/metal finishing. |
Demand-side: Seasonal uptick in value, by US construction, agrochemicals, and tire manufacturing in Q1 boosted realizations. Q2 slowdown in auto/rubber and construction sectors softened due to weak demand. - Supply-side: Indian producers faced higher energy costs and freight volatility. Oversupply in global markets pressured prices. |
Mar 2025: Export values peaked at 56.5 million USD from 48.4 as US buyers secured supplies for construction season, fertilizer demand, and tire production cycles. Even with lower volume 5.8 in Feb 25 and higher value 56.5 million USD, drove strong earnings. |
Apr–Jun 2025: Export values declined (in range 38.7 to 30.4 million USD from 56.5 million USD) as commodity chemical prices corrected globally, construction and auto sectors in the US slowed, and oversupply reduced value realizations. Volumes held moderate levels (in range 6.1–8.3 thousand MT), but value erosion reflected weak demand. |
In Feb–Mar 2025, tariffs drove a sharp rise in per-unit export values as costs were passed to US buyers amid resilient demand. |
|
Chapter |
Key Products |
Trend Overview |
Demand & Supply Concerns |
Upward Phase |
Downward Phase |
Tariff / Trade Note |
|
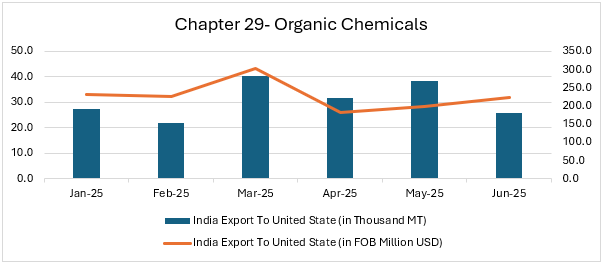
Chapter 29 – Organic Chemicals |
Methyl Aniline, Sodium Gluconate, Citric Acid, Dicamba Acid, Methyl Phthalate, Diethyl Maleate (DEM), Calcium Propionate, Benzyl Chloride, Tributyl Phosphate, Sorbitol and many more other products exports to US |
Exports to the US fluctuated in volume (22.1–40.5 thousand MT) and value (182.4–303.9 million USD) during Jan–Jun 2025. March saw the peak in both tonnage and value, while April–June reflected weaker realizations despite moderate volumes. End-use industries impacted include pharmaceuticals, agrochemicals, plastics & resins, food & beverages, construction chemicals, and industrial solvents due to weak demand. |
Demand-side: Agrochemicals peaked in Q1 with US sowing cycle. Food & beverages stable but pressured by cheaper ASEAN/Chinese supply. Pharma intermediates steady. Supply-side: Feedstock volatility (benzene, maleic anhydride, corn/sugar), high freight, and global oversupply compressed margins. |
Jan–Mar 2025: Exports surged with values between 232.2–303.9 million USD. Even at low Feb tonnage (22.1 thousand MT), strong unit prices kept realizations firm. March marked the highest tonnage (40.5 thousand MT) and value (303.9m USD), supported by agrochemicals, pharma, food and other industries. |
Apr–Jun 2025: Exports corrected in value (182.4–223.4 million USD) despite volumes holding at range 25.8–38.4 thousand MT. Price softening was driven by weaker US end use industries demand, seasonal slowdown and oversupply. |
US trade tariff impacted organic chemicals segment of India, moreover competitive pricing pressure from ASEAN suppliers further constrains exporter market margin, here GST reform will play vital role in margin and support on diversification of the market |
|
Chapter |
Key Products |
Trend Overview |
Demand & Supply Concerns |
Upward Phase |
Downward Phase |
Tariff / Trade Note |
|
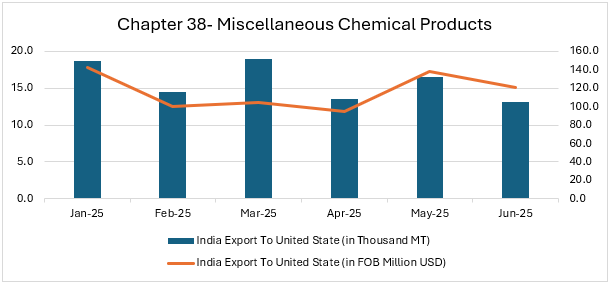
Chapter 38 – Miscellaneous Chemical Products |
Coconut Shell Based Steam Activated Carbon, Distilled Fatty Acid C16–C18, 2,4-D Acid, Herbicides, Fungicides, Chlorinated Paraffin, Glufosinate Ammonium, Pyroxasulfone, Chloro Fluoro Propane and many more other products exported to US |
India Exports to the US fluctuated range between 13.1–19.0 thousand MT and USD 94.6–142.7 million during Jan–Jun 2025. March registered peak volumes (19.0 thousand MT), while May recorded the highest value (USD 138.1M after Jan 25), reflecting strong agriculture season demand. End-use industries included agriculture, crop protection, water treatment, detergents, plastics, and specialty chemicals. |
Demand-side: US agricultural season created strong pull for herbicides, fungicides, and crop-protection products in Mar and May. Water treatment and industrial demand for activated carbon and fatty acids add. Supply-side: Indian exporters maintained sufficient inventories in Q2 ahead of tariff hikes. |
Jan–Mar 2025: Volumes remained firm with March peaking (19.0 thousand MT), reflecting strong buying in agriculture and industrial segments. May 2025: Export values surged to USD 138.1M on high buying demand. |
Apr–Jun 2025: April and June saw weaker volumes (13.5, 16.6, 13.1 thousand MT), reflecting softer procurement and cautious buying under tariff pressure. |
US tariffs up to 50 per cent imposed on Indian industries eroded competitiveness, especially versus ASEAN and others. GST reforms provide partial margin relief by lowering tax incidence but cannot fully offset tariff burdens. |
