
-b (1)-_Big.jpg "Global Ethylene Demand Rises, India Expands Capacity, Prices Drop Sharply in 2018-2025")
Global ethylene consumption expanded from 157 MMT in CY2018 to 184 MMT in CY2024, reflecting a cumulative increment of 27 MMT. This growth pattern aligns with the continued penetration of ethylene-derived polymers and intermediates across applications such as:
- Polyethylene grades (HDPE, LDPE, LLDPE)
- Ethylene oxide and subsequent MEG/polyester chain
- Ethylbenzene/styrene derivatives
- Vinyls via EDC/VCM routes
Based on prevailing demand indicators and segmental pull from polymers, polyester fibre, and chemical intermediates.
India’s Ethylene Capacity Evolution (2024–2028)
Parallel to global demand trends, India has emerged as a structurally expanding ethylene producer. Ethylene nameplate capacity in India reached ~8.8 MMT during 2024–25, supported by expansions within integrated petrochemical complexes. Projections indicate further capacity enhancement to over 9.4 MMT by 2026–28.
Ethylene Price Movement Analysis throughout the year 2025
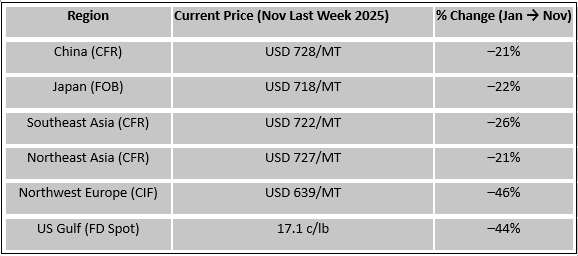
Price Decline Magnitude
The cumulative price decline between January and November 2025 was significant:
- Asia: $230–270/MT
- Europe: $500–550/MT
- United States: $280–320/MT
This contraction can be theoretically attributed to:
- the deceleration of naphtha feedstock values,
- weaker derivative margins,
- high cracker operating reliability, and
- incremental exports from China and the US displacing regional balance.
Key Technical Insights
Europe Exhibits the Largest Price Collapse:
- CIF NWE prices fell 45 per cent, the steepest globally.
- Weak cracker margins, low styrene/PVC offtake, and high energy cost exposure drove contraction.
US Gulf Prices Declined Sharply Despite Cost Advantage:
- FD spot values dropped 46 per cent, reflecting ethane oversupply and depressed derivative exports.
Asia Saw Moderate-to-High Price Correction:
- China, Japan, NEA: 24 per cent decline
- SEA: 28 per cent decline, the highest within Asia due to imported cargo pressure.
Ethylene Demand Distribution Across Key Derivatives

1. Polyethylene Dominates (>60 per cent)
More than 60 per cent of global ethylene is directed to the polyethylene chain, making it the single largest derivative sink. This includes:
LLDPE: films, flexible packaging
LDPE: extrusion coatings, laminations
HDPE: pipes, blow molding, rigid containers
Its dominance means that polyethylene industry trends significantly influence global cracker operating rates.
2. Vinyls/EDC Chain at 15 per cent
Ethylene dichloride production (primarily via ethylene + chlorine) accounts for 15 per cent of ethylene use, feeding into:
- VCM
- PVC resin
- Construction, pipe, fittings, flooring materials
Highly sensitive to construction cycles.
3. EO/MEG Chain at 8 per cent
Ethylene oxide, followed by monoethylene glycol (MEG), contributes another 8 per cent:
- Polyester fiber
- PET bottle resin
- Coolants, surfactants
Global textile and PET packaging trends influence this segment.
