India and South Korea are set to resume negotiations on the current CEPA. This analysis would help Indian textile exporters to identify where Indian textiles lack in the South Korean market and what should be discussed during the negotiations with respect to Indian textiles.
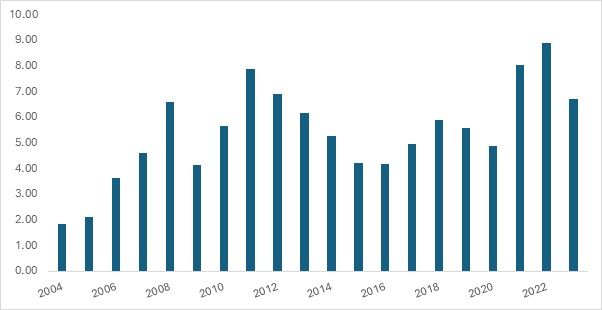
Exhibit 1: India’s export to South Korea from CY 2004 To CY 2023 (in $ billion)
Source: TexPro, ITC Trademap
Exhibit 1 shows the trends in Korea’s imports from India over the period from 2004 to 2023. From 2004 to 2008, imports steadily increased, with a significant jump in 2008, reaching $65.81 billion. The jump in 2008 could be attributed to the CEPA between the two countries. However, in 2009, there was a sharp decline to $41.42 billion, likely due to the global financial crisis. Afterwards, imports fluctuated but in general rose, with a notable increase in 2011 and 2022, reaching the peak of $88.97 billion in 2022 given the pent-up demand post COVID-19. The import values dipped in 2015 (MERS outbreak in South Korea) and 2020 (due to the COVID-19 crisis) but rebounded strongly in the following years, particularly in 2021 and 2022, indicating a recovery and a strong trade relationship. Exhibit 2 reflects both global economic trends and Korea’s growing demand for goods from India.
In-depth analysis of the textile market between India and South Korea
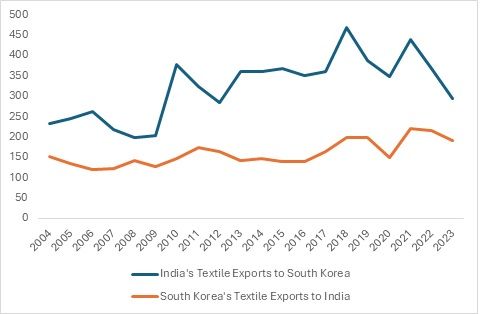
Exhibit 2: India and South Korea Textile Exports from CY 2004 to CY 2023 (in $ million)
Source: TexPro, ITC Trademap
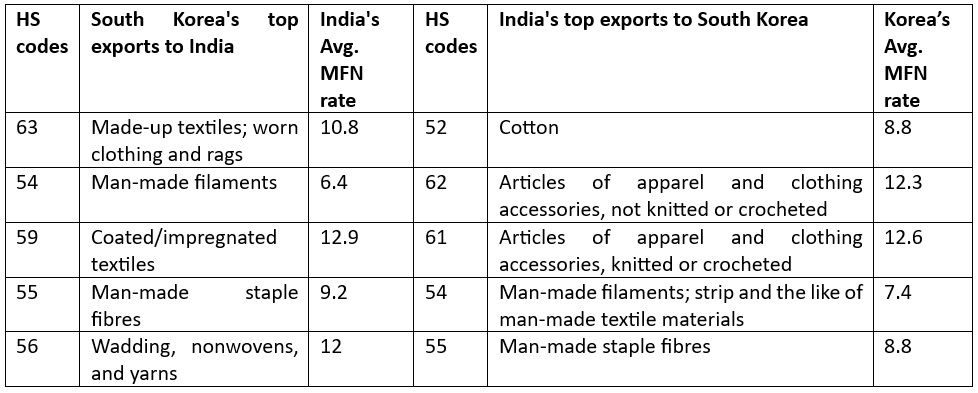
Table 1 : South Korea and India’s top textile exports and Most Favoured Nation (MFN) rates
Source: WITS database, ITC Trademap, F2F Analysis
India has been a major exporter of textiles in most of its Free Trade Agreements. However, in the case of South Korea, Indian exports are majorly mineral fuels and oils, organic chemicals and automobiles. Textiles also forms a major part in the exports, but they have not secured a substantial share in the Korean market.
India exports a substantial quantity of textiles compared to South Korea, which majorly exports home textiles to India for which India has an MFN rate of 10.8 per cent. Similarly, India exports cotton as a major product to South Korea. The South Korean MFN tariff rate for cotton is 8.8 per cent. If we were to calculate the added MFN rates of all the top 5 products, South Korea seems to be concentrated on products with high Indian MFN rates. India benefits majorly from only apparel categories (HS 61 and 62) with respect to tariffs. With India’s MFN rates down to zero per cent after the CEPA, South Korea benefits in major categories of made-up textiles, coated/impregnated textiles, man-made staple fibres, and wadding, nonwovens and yarns where it faces high MFN rate from India pre-CEPA. South Korean textile exporters have majorly focused on products where it will get major profits when the CEPA is effective.
Issues prohibiting Indian textiles from entering the South Korean market
FTA agreements with other major textile economies
South Korea has free trade agreements with Vietnam and Türkiye, the main leaders of finished textiles products which fetch higher profit margins due to their high MFN rates along with exporting high value products within the textile industry. South Korea’s FTA agreement with the ASEAN countries has also proven to be beneficial for countries like Indonesia, Myanmar and Cambodia which feature in the top 10 textile exporting countries.
Vietnam increased its percentage share from a mere 2.7 per cent to 4.3 per cent within a year of the ASEAN FTA coming into effect. It has progressively increased its share, which stood at 25.1 per cent in CY 2023. Both Indonesia and Myanmar have not been able to increase their shares but have been consistent within the range of 2 to 4 per cent. Türkiye’s textiles have not seen a significant uptick in market share but there has been a constant point increase till 2023. However, the case of Indian textiles is striking; India began with a market share of 4.8 per cent in 2004 declining every year, peaking marginally in CY 2010, the year after FTA came into effect. Since then, Indian textiles have only witnessed decline with only 1.9 per cent share in the year 2023.
Trade Requirements – Does India fulfil the conditions?
India’s major export material happens to be cotton (HS code 52) which has lower trade requirements compared to finished goods such as apparels and home textiles. India has not been able to comply on non-tariff barriers. Indian exporters face high non-tariff barriers in the form of certifications requirements and stringent guidelines, making it difficult for Indian goods to penetrate the South Korean market.
Under the CEPA, Indian textiles has a stricter rule compared to other goods. With respect to textiles from HS codes 50 to HS code 63, only seven per cent of the goods produced can use non-originating materials, i.e., materials from countries other than India. India is largely dependent on synthetic and man-made fibre from countries such as China, and has not particularly concentrated its efforts towards enhancing its own capabilities. MMF based and synthetic fibre-based apparels feature majorly in the top 20 list of imported products by South Korea. India’s dependence on raw material inputs would put its finished textiles in the list of products not gaining from the tariff benefits.
South Korea’s Market Demand – Is India catering to the Korean market?
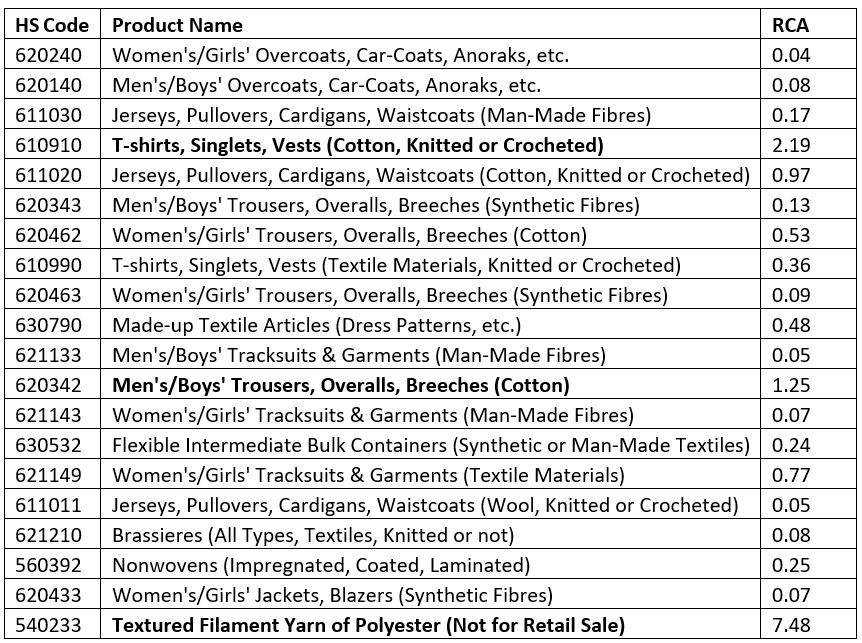
Table 2: India’s Revealed Comparative Advantage (RCA) for top 20 imported textiles products of South Korea
Source: F2F Analysis
Table 2 is an analysis of South Korea’s top imported textile products. Out of the top 20 listed, Indian has a Revealed Comparative Advantage (which means an edge over the other countries) in exporting 3 products. These products are – Cotton T-shirts, Men’s and Boy’s trousers in cotton, and Textured Filament Yarn of Polyester. India should concentrate on upscaling production of these products which could enable the country to become the primary supplier of these 3 products to South Korea.
However, it is concerning that India has not been able to capture any of the major top 10 textile products that are imported by South Korea. Out of the top 20 products, only three feature in the RCA for India out of which two are cotton based products. India exports textured filament yarn of polyester but has not been able to ship finished products made from the same material. South Korea relies more on its other FTA partners and mass-producing countries such as China and Bangladesh.
In conclusion, despite the CEPA with South Korea, India has not been able to increase the share of Indian textiles in the South Korean market. The major reasons identified are both internal and external. External factors include South Korea having major free trade agreements with textile producing countries such as Vietnam and other ASEAN countries, and Türkiye which further adds to the complexity. Non-tariff measures used by the South Korean government has also proven to be detrimental to the exports of Indian goods to South Korea. Despite a CEPA in place, major high-value products such as apparels and home textiles have 17 to 22 trade requirements whereas raw materials do not have as many. Internal problems include India’s reluctance to upgrade its product standards. Therefore, India should try to include raw materials, that it largely exports, in the production of finished goods. This would help satisfy the Rules of Origin requirements of the CEPA and would also lead to exports of higher quality goods.
ALCHEMPro News Desk (NS)
Receive daily prices and market insights straight to your inbox. Subscribe to AlchemPro Weekly!